
How to Use River Flow Information to Improve Your Fishing Success
Water, water, water! If you’re a Californian, chances are that it’s often on your mind. We complain there’s too much or (more often, these days) too little, we try to conserve it, and we debate public policies that deal with it. In addition, as fly fishers, we’re even more obsessed with water than the average Californian. We think about its color, its temperature, and many other variables. Among the most important of those variables is the rate at which water in your favorite stream is flowing.
One way to improve your fishing success is to seek a better understanding of river flows in California and the complex factors that determine them. What follows includes a bit of science, a sprinkling of history and politics, and, above all, some practical information regarding what determines fishable flows in our major rivers and how to use valuable sources of Web-based information about them.
Determinants of Flow Rates
Cubic feet per second is a measurement of a flow rate representing a one cubic-foot volume of water flowing every second. In other words, it equals the discharge through a rectangular cross section one foot wide by one foot deep, flowing at an average velocity of one foot per second. Higher rates of cfs represent a higher volume of water and a faster rate of flow over a given area.
Nature and human activities are the primary determinants of the rate at which water flows in our rivers. Nature’s contribution is precipitation in the form of rainfall and snowmelt, and although global warming is changing the mix, snowmelt still plays a more important role in determining water flows in the Golden State. Human intervention appears most prominently in the building and management of dams. A high percentage of California’s precipitation is captured and stored in the state’s thousand-plus reservoirs, some dating back to the nineteenth century.
As a result, the flows of some rivers are chiefly influenced by the decisions of dam managers. The decisions of dam managers concerning water flows, in turn, have five principal determinants: demand for electricity generated by hydropower facilities, demand for water for agricultural purposes, demand for water for municipal purposes, governmentally-mandated flows to protect certain species or provide for habitat protection and restoration, and flows (sometimes mandated by government) to enhance recreational activities. Managing flows for agricultural and municipal uses has the greatest effect on river flows in California. In addition, managing flows for agricultural and municipal uses obviously conflicts in many instances with habitat protection and recreational uses, including fishing.
Why Flows Matter for Anglers
Apart from basic safety considerations, flows can have a significant influence over fishing tactics and can spell the difference between angling success and failure. Many fly fishers are fond of referring to “perfect flows.” The term is obviously highly subjective, but “perfect flows” usually represent a stable period after the peak run-off has occurred when water clarity and hence visibility is fairly good and much of the riffly water is moving at a brisk walking pace or slower.
While these conditions are often seen as ideal and attract more fly fishers, a skilled person can succeed under more extreme conditions by modifying tactics and taking advantage of the fact that fish must continue to eat under tough flow conditions. In the case of very high flows, trout will seek out the “softer” water, water that has less velocity, so the fish don’t have to expend too much energy to hold there. Consequently, during periods of high flows, you will want to look for low-speed spots immediately adjacent to the banks, in back eddies, and possibly in deep, relatively slow pools.
Another useful strategy during high flows is to move farther upstream, where the main river is normally less affected by the added flows and discoloration contributed by feeder streams. For instance, on the upper Sacramento, the Dunsmuir area may offer slower and cleaner water than locations farther downstream, such as Dog Creek. In faster, more colored water, flies with a lot of contrast are usually more successful. Ralph Cutter’s orange-and-black Goblin streamer is a popular contrasting pattern.
Under extreme low-flow conditions, which often occur in the late summer and fall, you can once again take advantage of the reduction in the amount of comfortable holding water. Look for deeper pools and subtle increases in depth in otherwise shallow areas. With the fish highly concentrated, presentation often outweighs fish-finding skills in terms of importance. Camouflage clothing, stealthy movements, and longer, finer leaders often with smaller, more realistic flies all help then.
During the snowmelt period, anglers need to be aware of changing conditions throughout the day. High temperatures may trigger snowmelt, leading to higher flows, colder water temperatures, and discoloration of the water. These factors may affect fish behavior and hatch activity, as well as present possible safety considerations.
Know Your Flows
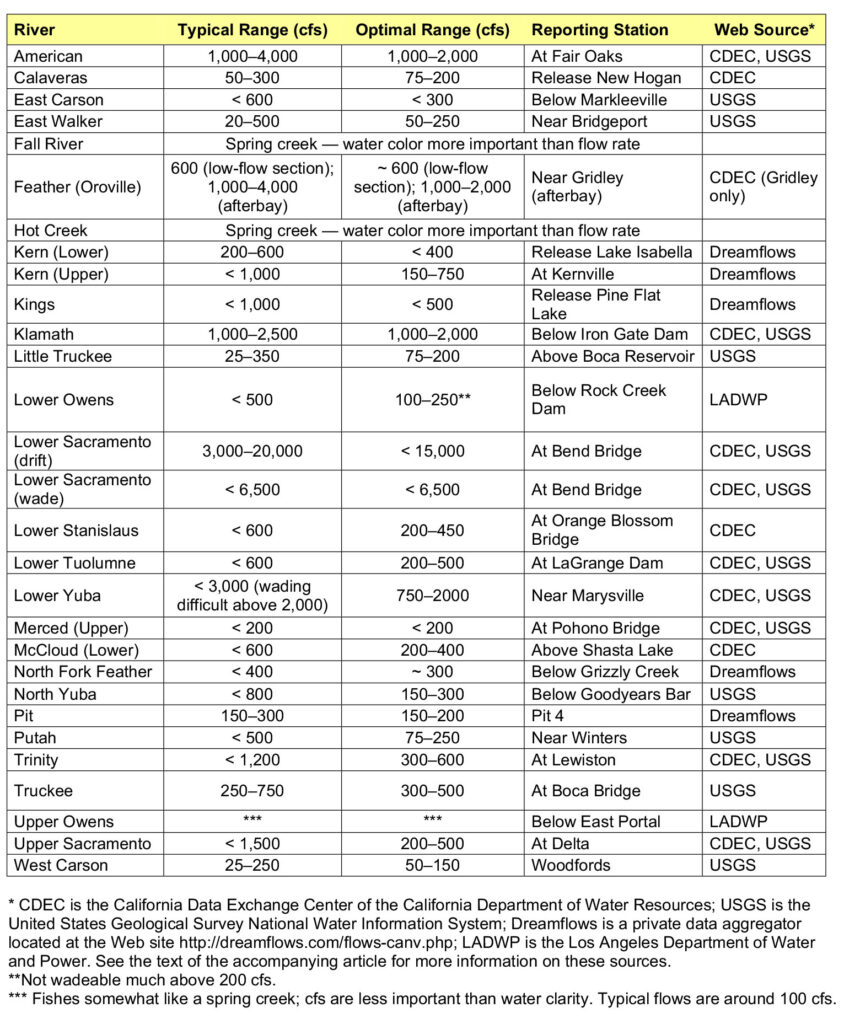
Cubic feet per second are represented by numbers that mean little unless you know what range of numbers is fishable and safely wadeable for the places you fish. Based on personal experience and consultation with knowledgeable fly fishers, I have provided a starting point. In the table on the next page, the “Typical Range” represents flows that at the low end have enough water to provide safety and comfort for the fish and at the high end offer at least some soft water at the edges to make fishing productive. At the high end, many people will not feel comfortable wading beyond the edges, much less getting into the water. The “Optimal Range” represents relatively safe wading conditions and a high percentage of habitable and fishable water.
As we are all aware, success on the river usually requires a combination of science and art. Cubic feet per second represent the left-brain part of the fishing equation, and but one piece of it. The successful angler will use flow information in combination with other data, such as water temperature, water visibility, and hatch activity, as well as the intuitive contribution from the right side of the brain.
Proper use of flow numbers may also require some local knowledge and experience. For example, Bill Carnazzo, who guides regularly on the upper Sacramento, has a rule of thumb to adjust for the fact that the Delta station sits at the lower end of the river, some 35 miles downstream of the outflow from Siskiyou Lake. Likewise, Tim Hutchins, who guides in the Yosemite area, applies his own rule of thumb to determine if the Merced is fishable. Tim believes that if the water is too cold to wade wet, then there’s too much snowmelt to fish the river’s flows effectively.
Another consideration is that several rivers have more than one useful reporting station, including the lower Yuba, the North Fork of the Feather, and the Truckee. If you use station readings other than those listed below, you may need to recalibrate. For instance, the “At Truckee” station sits upstream of the “At Boca Bridge” station and therefore has substantially lower flows than the latter.
Where to Find Useful Information
Given the importance of flows, we are fortunate to have a number of websites that provide information on flows in close to real time, as well as other related and useful information.
The California Data Exchange Center (CDEC, http://cdec.water.ca.gov/ river/rivcond.html) is sponsored by the California Department of Water Resources. This automated data-collection network started as a “small system designed to obtain data urgently needed to provide river stage forecasts and flood warnings for the North Coastal area and for the Central Valley.” It grew rapidly and now encompasses over 1,000 stations and nearly 10,000 sensors that measure rain, snow, temperature, wind, barometric pressure, humidity, and stream stage, transmitting this information in real time via microwave, satellite, and network. A glance at the home page will reveal the breadth of useful historical and current data. Fly fishers will probably focus most on the real-time flow data found under “Current Conditions/River Conditions.” However, they can also benefit from information on water temperature (available for some, not all, locations), historical flow data, and reservoir levels and scheduled releases. On the “River Stages/Flow” page at the URL given above, you will see a list arranged by region, and you may have to click through some of the selections to find what you are seeking. For instance, to find the McCloud flows, you would click through the “Sacramento River to Lake Shasta” link. For historical research, the “Historical Data” and “Data Plotter” links under “Most Popular Links” can be useful.
The National Water Information System (http://waterdata.usgs.gov/ca/ nwis/current/?type=intro&group_key=huc_cd) is sponsored by the United States Geological Survey (USGS) in the Department of Interior. This site covers over 400 rivers, some of which overlap with the CDEC database. The waters can be listed by county, river basin, hydrologic unit, or customized to your personal needs. The page accessed by the URL given above provides a colorful plot map depicting current flows against historical flows, ranked by percentile, and also a choice of clicking through to see summary readings for all sites (the “Statewide Streamflow Table”). You can build a customized view via “Build Table” or “Build Sequence.” Historical research is a bit less intuitive, but can be done on the “Statewide Streamflow Table” page by clicking on the station number or on “Customize table to display other real-time parameters.”
Dreamflows (http://dreamflows.com/flows-canv.php) is a website operated by a private person, Chris Shackleton, and is actually oriented toward whitewater enthusiasts. The information is pulled from primary sources, and the site is easy to use and visually friendly. The URL given above is the page for California and Nevada rivers, where you receive an excellent color-coded summary of current flows (as seen from a kayaker’s perspective) and some commentary, which at times includes water temperature, the rate at which the flows are rising or falling, and news about planned releases. You can drill down on individual locations and re-ceive historical flow information by clicking the name of the sensor site in the second column.
The Los Angeles Department of Water and Power database (http://www. ladwp.com/ladwp/aqueduct/showAqueductMap.ladwp?contentId=LADWP_A QUERTD_SCID) is far less extensive than the others, but it provides excellent visual representations of current flows in the eastern Sierra waters under LADWP jurisdiction. It can be used for Hot Creek, the Owens River, and some smaller eastern Sierra creeks. The website also provides some useful information about habitat-restoration projects in the Owens River Valley.
Okay, Let’s Go Fishing
Now let’s put this information to use. We’ll look at two scenarios. In the first, we’re going fishing tomorrow, and we want to know the current flow. In the second, it’s the dead of winter, and we want to plan a warm-weather trip timed to avoid the peak runoff. We will use the upper Sacramento for the first scenario and the East Carson River for the second.
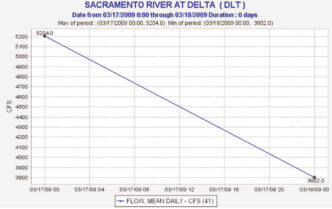
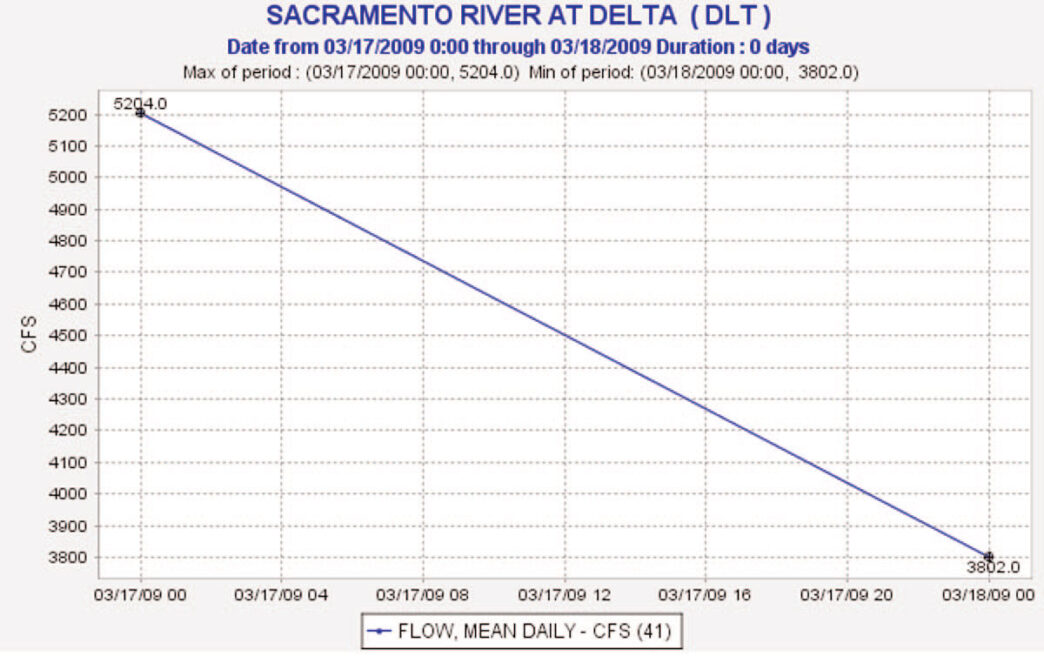
To find the current flow numbers for the upper Sac, we can go to either the state or federal database or the Dreamflows site. Using the CDEC site, we click through “River Conditions” to “Sacramento River to Lake Shasta,” which sits under the “Sacramento River Region” section, and we get the results shown in the graph above. We know that flows in the range of 3,500 are much higher than optimal, and we would probably opt to stay home (or, if you are like me, try to find a different river). However, for illustration purposes, let’s say we liked the flows. In that case, we would go on to check on the stability of the flows over recent days and the water temperature. The water temperature is easily attainable by choosing “Daily Water Temperatures” under “Most Popular Links,” then scrolling down to the appropriate station and selecting the appropriate month. Recent flows can be found by using the “Data Plotter” option.
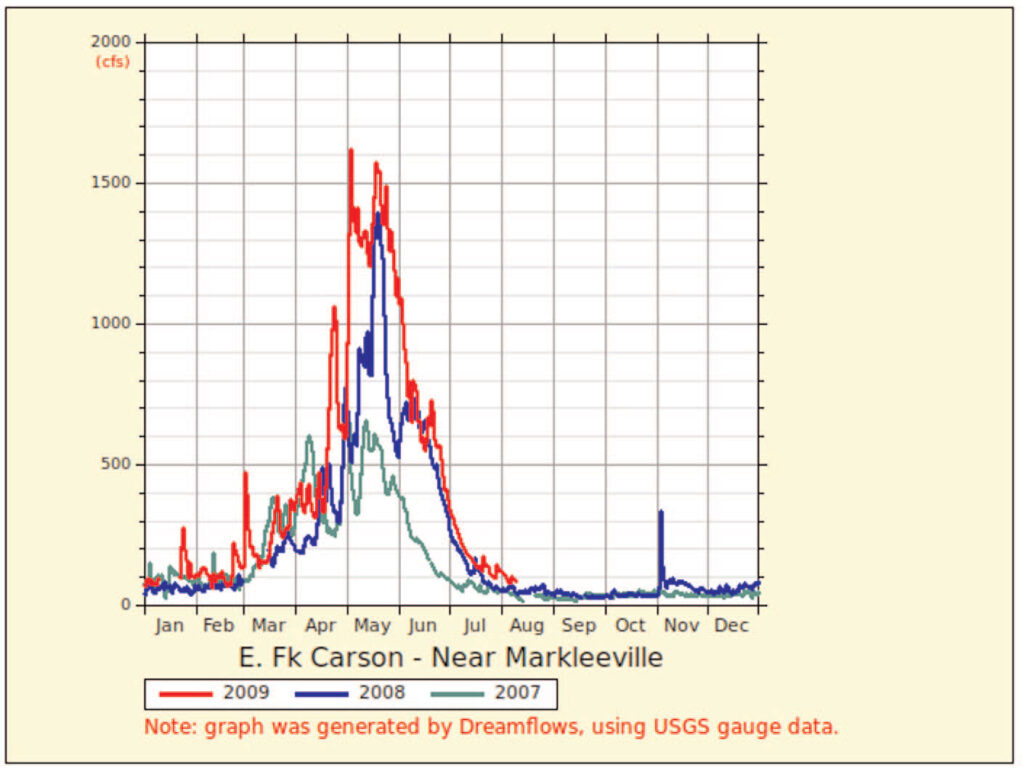
In the second scenario, we need to determine when flows historically start ebbing from the peak of the snowmelt in order to plan our future trip to the East Carson. For the CDEC and USGS sites, we would need to customize the information. Fortunately, the data often go back 20 years. However, an easier and more visual result exists in Dreamflows. At the URL given above, scroll down to “California — East Slope Sierra” and find “E. Fk Carson/Near Markleeville,” then click on “Near Markleeville.” You will then see a nice graphical depiction of the flows over the last five days. To see the last three years, scroll down to the bottom and click on “Show 3 Years,” which produces the results shown in the graph shown below. You can see that the flows peaked in mid-May each of the last two years, started entering the optimal range in June, and stabilized at midsummer flow levels in July.
Note that the graph is color-coded by year, which allows you to correlate it with other data. The timing of the runoff, for example, depends largely on the snowpack that accumulated during that winter. Since 2007 and 2008 were below-average years, the peak occurred earlier than normal, lasted for a shorter period than normal, and peaked at a lower level. If we had looked at 2006, the last above-average precipitation year, we would have seen a different profile. We obviously need to adjust our expectations to the developing conditions for the upcoming year. Sierra snowpack measurements are the best predictor of future flow conditions.
Fortunately, California’s Department of Water Resources conducts three surveys each winter to measure snowpack. After each survey, they post the results and an informative press release on their website (http://www.water.ca.gov). In addition, you can do more in-depth and current research on the CDEC site by using the “California Cooperative Snow Surveys” link under “Related Links” and the “Snow” tab along the main banner. Reservoir capacity and releases can also be important, and I would encourage you to explore the site for more information on these topics, as well.
The Present and the Future
Scientists predict that global warming will cause less snowfall, more rainfall, earlier snowmelt, and more flood conditions. These dynamics will surely change the nature of the flows in our rivers. However, as you read this, chances are that the flows are perfect somewhere in California. So check the Internet flows sites, use the table printed here as a reference, call the local fly shop, fill your gas tank, pack your gear, grab your rod, and lock your navigation system into that perfectly flowing river. Go with the flows — and good luck!
Dams and Conflicts over Water Use
Dams and their effects on angling are part of the reality that every California fly fisher must face. The management of flows from dams is also a major source of conflict in the water wars that flare up around the state.
Rivers in which the flows are largely determined by dams and dam managers include the East Walker, the lower Owens, the lower Sacramento, the lower Stanislaus, the lower Yuba, the Little Truckee, the lower McCloud, the Middle of the Fork Stanislaus, the North Fork of the Feather, the Pit, the Trinity, and Putah Creek.
By contrast, rivers principally influenced by rain and snowmelt conditions include the Carson, the Kern, the upper Merced, the North Fork of the Yuba, the upper Sacramento, and the whole set of North Coast streams, where the flows are influenced by rain, rather than by snow. The flows in spring creeks, which mainly rely on self-sustaining underground springs and are characterized by relatively constant flows, also are largely determined by natural factors. Prominent spring creeks include the Fall River, Hot Creek, Yellow Creek, and, to some degree, the upper Owens.
In the major dam-regulated rivers listed above, the operators of the dams play the key role of determining how much water is released and when. Depending on the facility, the operator may be a federal or state agency, local water district, or a commercial company such as PG&E, acting under a 30-to-50-year license from the government. In a typical case, the operator will enter into contracts with agricultural districts to supply a certain amount of water at a given price. Naturally, the greatest demand for agricultural irrigation will occur during the summer and, as a result, the releases will normally be highest at that time. In other cases, water releases will be dictated by government policies or legal settlements designed to protect fish habitat or to support recreational use. It is here that conflicts over the uses of river flows arise. For example, since completion of the Trinity and Lewiston Dams on the Trinity River in 1963, up to 90 percent of the basin’s water runoff has been diverted downstate under the federal government’s Central Valley Project to San Luis Reservoir and then transferred onward. The primary beneficiary has been the Westlands Water District, which serves 600 farms in Fresno and Kings Counties averaging 900 acres each and producing everything from cotton to almonds.
Over the years, conservationists have had some success in reducing the diversions and regularizing the flows of the Trinity, but nonetheless, the demands of agriculture continue to have a major effect on the river’s fishery. A negotiated target schedule calls for maximum flows through late spring and summer, tapering down in steps to a steady state of 300 cfs from mid-October to mid-April, when the Trinity sees most of its fishing pressure.
Likewise, in the 1960s, the California Department of Fish and Game recognized that the dewatered Owens River below Pleasant Valley Reservoir, known traditionally as the lower Owens, was having an adverse effect on fish populations. The DFG entered into agreements with the Los Angeles Department of Water and Power (LADWP) to establish minimum in-stream flow guidelines of 200 cfs during brown trout spawning season (from October to April) and higher flows of up to 500 cfs at other times. Also, the LADWP agreed that when it changed flows, it would do so gradually, to minimize potentially detrimental scouring.
Angling not only often conflicts with the agricultural use of water flows, it also sometimes conflicts with other recreational uses, such as whitewater kayaking and rafting. When dams are relicensed, many different interest groups have an opportunity to offer their suggestions. The recent relicensing of Pit 3, 4, and 5 by PG&E, for example, included conditions that provide new opportunities for whitewater enthusiasts. However, when fully implemented, Pit 5 will produce extremely high and unfishable flows over a couple of weekends in August and September, and all sections of the river will experience high freshet flows for three weeks in March, designed to mimic the natural process of peak runoff on a dam-free river. Fly fishers will need to be aware of these events and adjust their schedules and possibly their tactics.
In reality, most fisheries are influenced by a combination of human and natural determinants. The Truckee, for example, receives substantial snowmelt, but is also subject to discharges intended to support farms and communities downstream in Nevada, and to protect the cui-ui fish species and restore Lahontan cutthroat trout.
Robert Marshak


")